
TESTS ON RINSING METHODS FOR NON-REFILLABLE PET BOTTLES PART 1
Dipl.-Ing. (FH) Antonia Schmitt
Priv.-Doz. Dr.-Ing. Hartmut Evers
Dipl.-Ing. (FH) Jan Bechtluft
KHS AG, Bad Kreuznach
PET was launched as a bottle material about 20 years ago. This started a significant and far-reaching change within the beverage industry. This change is still ongoing because PET provides a form of packaging which is significantly lighter and can be molded into far more varied forms than glass. These are properties that enable effective promotional communication and which also serve to differentiate products from those of fellow competitors. The result is that the consumer can choose from among an increasing variety of different types of PET packaging. Innovation encourages further innovation. New generation PET bottles which have an oxygen barrier can even be used for bottling fruit health drinks, (flavored) mineral water, and beer. This results in yet further increases in the popularity of PET as a packaging material.
In order to reduce the cost of materials, non-refillable PET bottles with increasingly thin walls are coming onto the market. Non-refillable PET bottles are produced in a wide range of shapes in order to fulfill the mechanical requirements of the beverage industry in terms of stacking strength, pressure resistance and handling rigidity.
The shape has a decisive influence on the rinsing process both for non-refillable and refillable PET bottles. Tests at KHS have confirmed the differences in rinsing behavior resulting from rinsing ribbed PET bottles in comparison with smooth PET bottles.
The term rinsing does not denote bottle washing in the normal sense, but simply rinsing out the bottles. This means that different conditions need to be incorporated in a test method for the rinsing process than for cleaning techniques in a bottle washer. In the latter case, dirt must adhere so firmly to the bottle that measurable residues are still present even after an intensive washing process. For this reason, substances that can be virtually burned into the surface are used. A wide range of combinations of substances has already been tested for this. Bottlers often use their own mixtures.
Whatever the substances used, until now measurement methods have not been adequate to quantify the remaining dirt more precisely. This is where our tests come in. What is required is to find a type of soiling[1] for a rinser that only adheres slightly to the bottles, which can be easily rinsed out leaving a residue that can be detected following the rinsing process. What makes this more difficult is that it should also be applicable to PET bottles with a highly hydrophobic surface. Due to the low surface energy, it is difficult to create a layer of dirt that adheres evenly. To date, there is no known standard soiling substance for rinsing PET bottles that fulfils the requirements mentioned.
With the aid of statistical experimental design (DoE = Design of Experiment) a large quantity of information can be obtained with relatively little experimental effort. It is therefore possible to identify both the effects of the factors on the dependent variable as well as interactions between the individual factors.
A brief digression on rinsing
The term ‘rinse’ denotes the rinsing of bottles before they are filled. This is necessary particularly for new bottles that do not go through the bottle washer. The task of a rinser is to remove dust and other dirt particles from the bottles, because foreign bodies can have a detrimental effect on the shelf life of the product and can lead to release of the carbon dioxide when bottling carbonated beverages. Rinsing media include water (cold or hot), air, sterile air, ionized air, ozonized water, disinfectants, and saturated steam. The chosen method depends entirely on the nature of the application.
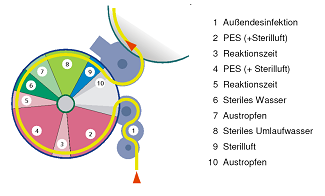
Rinsing times range from three to ten seconds, depending on the bottle size and rinsing concept. Figure 1 shows the processing sequence for rinsing PET bottles to be aseptically cold-filled after rinsing.
See Figure 1A brief digression into statistical experimental design
The aim of statistical experimental design (DoE = Design of Experiment) is to obtain the desired information with the minimum of time and expense. Only one parameter is varied at a time using the classical method of one-factor-at-a-time. This makes it easy to attribute the cause of a difference in the results, but the experimental expense quickly increases dramatically. Modern experimental design recommends investigating all conceivable combinations. Each result is used to calculate several effects. In addition, interactions between two factors can be identified. Consequently, more information is gathered with fewer individual experiments and this can be verified statistically. An effect is demonstrated if the results of a factor deviate significantly from one another for different levels of that factor. An interaction between two factors means that the effect of one factor is dependent on the value of the other.
Those influencing variables that are likely to be important are selected and comprise the factors which are varied in the experiment. The values taken by the factors in the experiment are called the factor levels. The results of an experiment are described by dependent variables. These can be measured values or parameters that are calculated from one or several measured values. It is possible to determine several dependent variables from one experiment. Experimental design covers the following steps:
· Description of the initial situation
· Determination of the objective of the experiment and the dependent variables figures and factors
· Setting up the experimental design
· Carrying out the experiments
· Evaluation of the results and their interpretation
· Verification, documentation, and further actions [Kleppmann 2006]
Kleppmann gives detailed explanations of these procedures in his book.
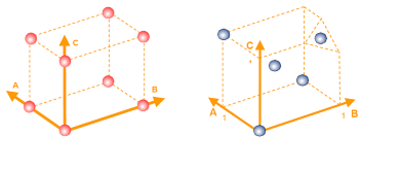
The aim of D-optimal experimental designs is to clearly describe the desired effects and interactions with minimal effort. This focuses on the following advantages: the number of levels of each separate factor, the interval between levels, the mathematical model and the distribution of sample points in the n-dimensional experimental space can be selected as desired.
See Figure 2
In contrast to fractional factorial designs, there is no mixing of interactions. In addition, the design can be extended with new influencing variables. Particular levels and combinations which are not feasible or do not make sense can be excluded [Ronniger 2007]. Unfortunately, there is still a disadvantage in that, in contrast to full factorial designs in which all combinations of factor levels are investigated, the experimental design is not orthogonal. However, usually only minor deviations occur. In addition, it can only be realized using suitable software [Kleppmann 2006]. Figure 2 shows a full factorial and a D-optimal experimental design with the factors A, B, and C. Orthoganality means that no correlation exists between the factors, i.e. these can be varied independently of one another. All full factorial designs are orthogonal. However, D-optimal designs with a central point in the middle of the experimental space are not.
Materials and methodsThe following laboratory equipment is required for the experiments: dispersion device, analytical balance, conductometer, spectrophotometer, pycnometer, refractometer, rheometer.
The suitability of fat, starch, mustard, pectin and Allura red AC powder (Sigma Aldrich) were tested as standard soiling substances for PET bottles to evaluate the effectiveness of rinsing.
Various methods for determining the residual soiling were tested. These methods are electrical conductivity, turbidity, density, viscosity, refractive index, and extinction.
Measurement systems analysis
All measurement systems display a certain degree of uncertainty. The analysis of results therefore shows random and systematic deviations. These are caused by imperfections in the measuring systems and methods and influences from the environment and operators. Measurement systems analyses define the extent of these uncertainties and allow a statement as to whether a test device is suitable for a particular measuring task [Linß 2003]. The following processes can be distinguished:
1. Accuracy and capability indices Cg and Cgk,
2. Repeatability and reproducibility precision and total scatter range with operator effect and
3. Repeatability and reproducibility precision without operator effect.
For procedure number 2, four methods are described:
1. The Range Method (RM)
2. The Average and Range Method (ARM)
3. The range and standard deviation method
4. The ANOVA method (Analysis of Variance) [Dietrich et al. 1998].
In this study, the average and range method (ARM) is used to evaluate the measurement system capability. This requires two testers to measure ten objects at least twice. These values are used to calculate the repeatability and reproducibility (R&R). In order for a new measurement system to be declared capable, %R&R ≤ 20% must apply, or for systems already in use, %R&R ≤ 30% [Ronniger 2007]. The evaluation is carried out using Visual-XSel® 10.0 software.
Preliminary investigations
Selection of soiling substances
As a result of the findings from the preliminary investigations it was decided to use both mustard and Allura red AC as the standard soiling substances. The decision was easy to make because both substances offer the ideal properties for detection. The other soiling substances tested such as fat, starch, and pectin were either difficult to apply to the hydrophobic surface of the PET bottles or were difficult to rinse off. It goes beyond the scope of this work to describe the entire test series. For this reason, only the two substances mentioned above are presented.
Determination of residual soiling
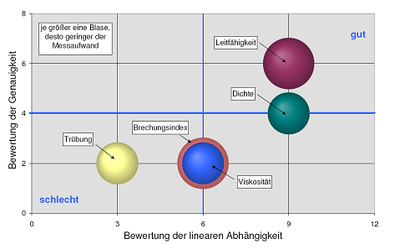
Determination of the residual soiling for the Allura red AC dye was carried out using extinction measurement, because of the considerable effort involved in detecting minor residues of this kind using other methods. Deciding on a method for mustard was more difficult, as several measurement systems are available for detecting this substance. The suitability of electrical conductivity, turbidity, density, viscosity, and refractive index were tested. The results are presented in a graph (see Figure 4). Calibration curves using the relevant measuring system were established in advance. Figure 3 shows two such curves for water/mustard suspensions. A non-linear curve, as obtained with the refraction index, results in elimination of this method.
We selected a method for determining residual soiling using a systematic decision-making process (see Figure 4). Weightings of times three for linear dependency, times two for accuracy, and times one for measurement effort were used for the decision criteria. Due to the non-linear dependency and/or greater effort involved with the refraction index, viscosity, turbidity, and density measurement systems, the decision was made in favor of conductivity for the mustard system, whereas for Allura red, extinction was the best detection method.
See Figure 4Measurement systems analysis
A measurement systems analysis was carried out for all the measuring instruments used. The result of the conductometer is shown in Figure 5 as an example. The repeatability and reproducibility for this instrument is 13.82%. It is therefore well below the limit value of 30%. Consequently, the conductometer was declared suitable for determining conductivity with the defined tolerance of 0.02 ms/cm. This result is also confirmed by the variation coefficient of 1%.
After completing these preliminary investigations and the measurement system analysis, Part 2 of this article "Tests on rinsing methods for non-refillable PET bottles" will deal with the factorial experimental design and the presentation and evaluation of results.
Figure 5: Results of the measurement systems analysis
Bibliography
Dietrich, E., Schulze, A.: Statistische Verfahren zur Qualifikation von Meßmitteln, Maschinen und Prozessen, Carl Hanser Verlag, Munich and Vienna, 1998, pp. 309–329
KHS AG: Product brochure: Innoclean – Flaschenrinser für höchste Ansprüche
Kleppmann, W.: Taschenbuch Versuchsplanung, Carl Hanser Verlag, Munich and Vienna, 2006, pp. 10–39
Linß, G.: Training Qualitätsmanagement, Carl Hanser Verlag, Munich and Vienna, 2003, p. 204
Ronniger, C.: Versuchsmethoden Statistik und DoE, Eigenverlag, Edition 10d, 2007, p. 121
