
Win/win situation
KHS line optimization gives beverage companies high line efficiency
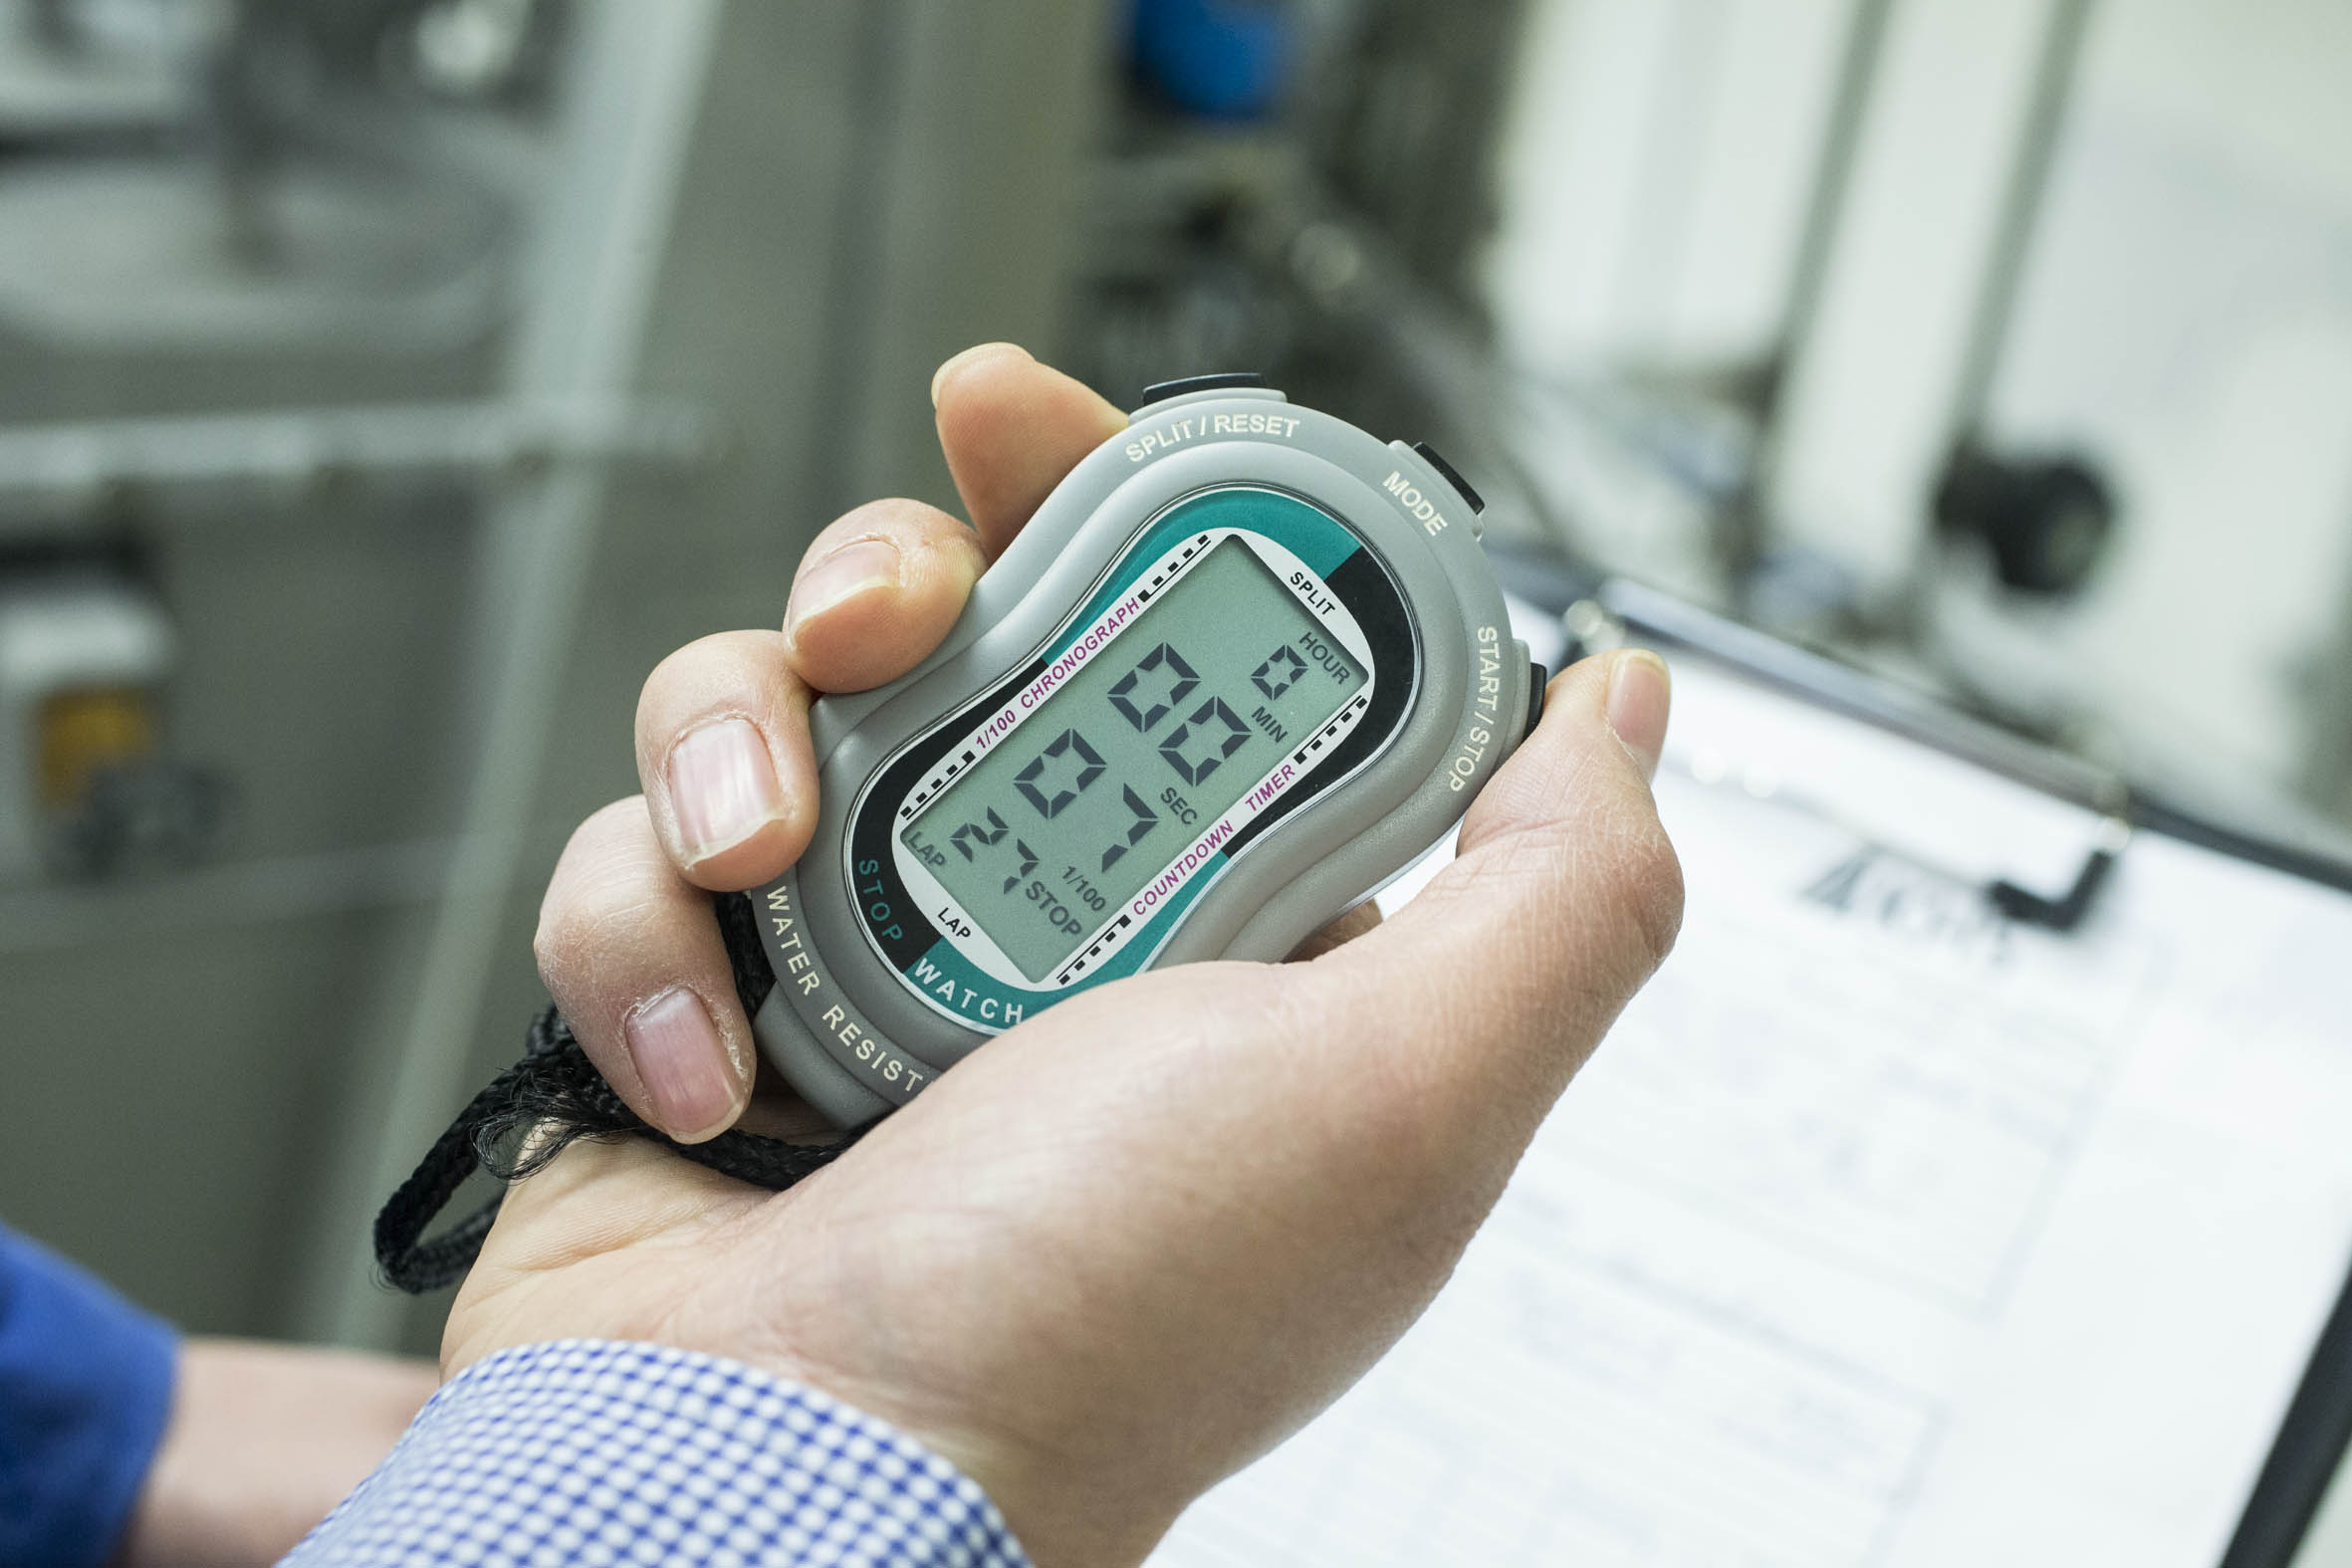
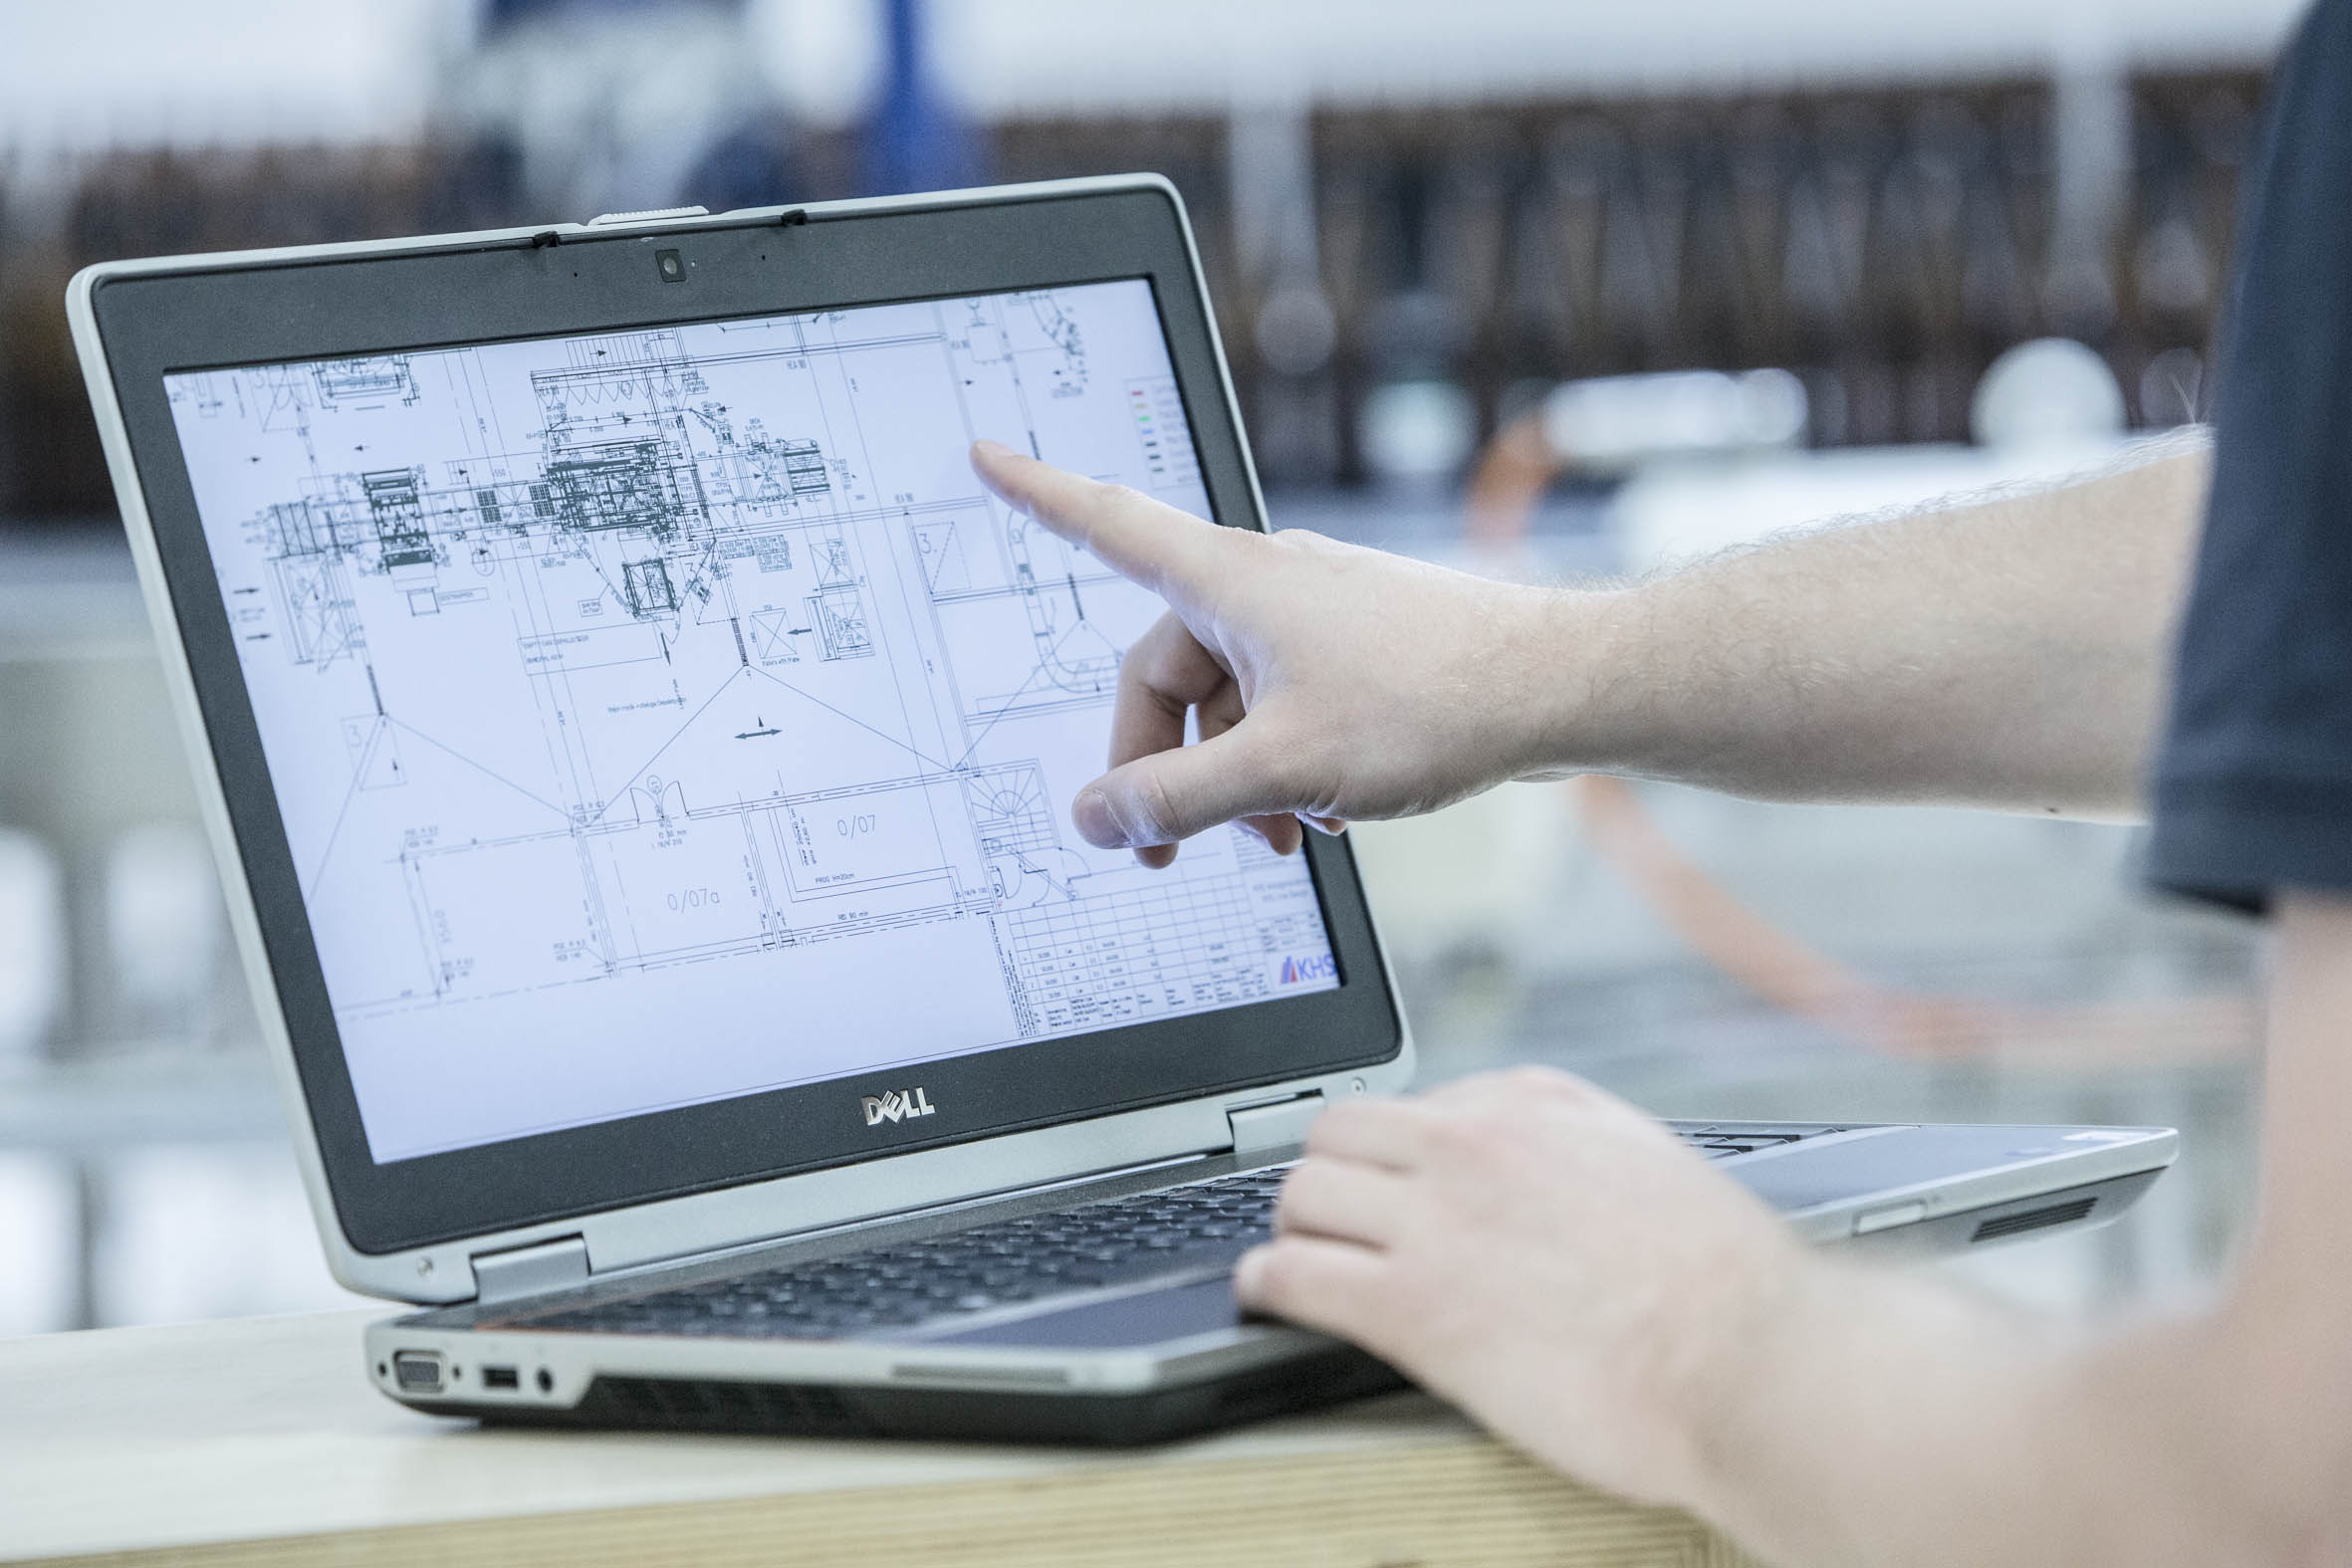
Christian Schlichtenbrede* Ilakshan Rameswaran** Line performance always plays an important role when investing in new filling and packaging technology. Customers want plant equipment that perfectly caters for all of their bottling requirements. Each and every line is accepted with a high degree of efficiency which usually far exceeds 90% for canning lines and is approximately 90% for glass and PET lines. The goal of every line acceptance is to achieve the highest possible line efficiency. It's thus all the more surprising to observe that in time interest in the level of line efficiency tends to dwindle in many beverage companies. As a general rule, a drop in performance results in a concrete loss in sales. So that bottling plants can get their production lines back into shape or retain high line efficiencies right from the start, KHS offers beverage companies worldwide the chance to optimize their lines and/or order service packages specifically tailored to suit their plant. The following article outlines exactly how line optimization works and what is to be expected of it. Lower line efficiency results in high filled product losses If, for instance, we take a returnable glass line that outputs 50,000 bottles per hour for 20 hours a day on 240 days in the year, a loss of just 1% in line efficiency results in 2.4 million fewer bottles being produced per annum. Various things can have a negative effect on line efficiency throughout the life cycle of a filling line. Technical faults could be the problem, for example, or changes in organization or logistics. Applied to the amount of product, each drop in performance means an increase in costs. It thus follows that an efficient filling and packaging rate means a drop in product manufacturing costs and thus a greater competitive edge for thebeverage producer. As a rule, as a result of the high personnel requirement, large investment sum, and line maintenance costs, filling and packaging technology is one of the most cost-intensive areas in a beverage company. KHS line optimization helps to specifically minimize these costs. *Head of Service Organization & Development, KHS GmbH, Dortmund, Germany. Phone: +49 231 569 10845. **Service Organization & Development, KHS GmbH, Dortmund, Germany. Phone: +49 231 569 10302. Be prepared: before line analysis starts If a beverage company opts for line optimization, the first step at KHS is to thoroughly prepare for an analysis of the current state of the line. As part of this process documents provided by the beverage bottling plant and those available at KHS are carefully studied. These normally include the line layout as well as machine data and facts on the individual machines regarding the year of manufacture, manufacturer, and any special extra functions. Documents on the line performance, production lists, information on core products and on those causing particular problems during processing are just as important. In general, the more data there is available, the more intense the preparation – and the more precisely the situation on site can be assessed. Operators must be involved A preparatory session on site prior to line optimization is extremely helpful, as this allows any unanswered questions to be personally discussed with the production manager. It is also essential to hold a preliminary talk with the operators who work on the line, during which they can be informed as to which optimization activities are planned. They can also provide KHS with information on any weak points on 'their' line. It's crucial that operators don't see line optimization as a personal control but as a chance to optimize the running of the line and boost performance – and to ultimately improve their working conditions. This creates transparency and promotes an exchange of ideas. In this context it's extremely conducive to entrust the company's employees together with KHS personnel with the activities which will be carried out during line analysis. Detailed observation of the line in operation Once all the preparations have been made, the next step is to closely observe the line in practical operation. The duration and extent of this line analysis depends primarily on the number of different products, bottle sizes, packaging options, and pallet combinations to be studied on the line earmarked for analysis. In all cases production must be run with the company's 'bread-and-butter' products and with those where the system usually strikes. Line analysis allows the best conclusions to be drawn when all filling and packaging options are included. Several KHS engineers are usually involved in line analysis. A team manager plans the assignment and stipulates various measurement points. This team manager is a senior engineer at KHS who has a very good general knowledge of all machines. The engineers are usually from the region where the company is based so that they speak the local language and are familiar with the prevalent culture. As mentioned above, the client's engineers should also be involved in the analysis process. A six-hour performance test is ideal for each product to be studied. Armed with stopwatches and documentation materials, all those involved note down in detail everything that occurs on their section of the line during its operation. All downtimes are recorded with the utmost precision and entered in a system specially designed for this purpose. The results include a graph of the overall equipment effectiveness (OEE), and calculations on the mean time to repair (MTTR) and mean time between failure (MTBF) for the above performance test. Pareto diagram quickly pinpoints sources of disruption Suggestions as to how the line can be optimized are then made based on this carefully compiled data. A Pareto diagram quickly pinpoints where the line is losing in efficiency and where the key sources of disruption are. It is theoretically possible to remove all sources of disruption; however, this often means large investments of time and money. For this reason attention is often first paid to those problem areas which seem to be responsible for the major losses in line efficiency. Detective instinct needed when troubleshooting When trying to find out just where the trouble lies, a certain detective instinct is called for. If faults are displayed on the filler, this doesn't necessarily mean that the filler is responsible. Experience shows that 90% of all malfunctions can't be found in the area they occur but in the technology up or downstream of it. For example, a filling system comes to a standstill several times a day because PET bottles have fallen over. The reason for this may not be the filler at all but could instead lie with worn transition points or incorrect cleaning of the conveyors. A repair or intensive cleaning session could be enough to notch the line efficiency up a few percent. All areas are always investigated from production plans through logistics processes to the qualification of personnel. There could be room for improvement anywhere. Actual speeds recorded to generate a V diagram Line analysis always includes recording the current actual speed of each individual machine. This is used to generate a V diagram which describes the drops in performance of the individual components and defined lead machine – usually the filler, and on PET lines the blow molder/filler monoblock. If no V diagram is produced (where the blow molder/filler monoblock is the lead machine, this is a diagram that represents one wing of the V), the machine's speed settings are no longer ideal. The reason for this could be that an operator may have set a certain machine to a faster or slower mode of operation in an attempt to correct a problem or increase line efficiency. If this is the case, within a very short time indeed the smooth conveyance of containers through the line is no longer ensured. Speeds must therefore be regulated so that a classic V diagram based on the Berge graph is created. It's very important here to explain just how high the loss in line efficiency can be due to a single regulation of speed. This helps to prevent any future random intervention. Determining perfect buffer segments Another fixed feature of line analysis is to determine the perfect buffer segment. Too small a buffer segment between single machines can leave too little time to compensate for disruptions; if the buffer segment is too large, this could prevent the line from retrieving its optimum operating point after a machine stop, for example, affecting the time to return to the normal situation (TRNS). KHS Innosim line simulation system illustrates effects KHS' Innosim line simulation system clearly demonstrates how optimizing buffer segments, any conversions or upgrades, or new speed settings on the machines – and much more – can affect the running of the line. The Innosim tool accurately visualizes the dynamic behavior of the line. The creation of each simulation model begins by entering global data into the simulation system, such as container and pack dimensions. Following this, the individual machine efficiencies, the expected disruption characteristics, and facts on the buffer segments are communicated to the system. An eight-hour shift can be simulated in a matter of seconds. In a few minutes, after many shifts have been simulated, a reliable prognosis on the line efficiency under the given conditions can be made. New situations can be quickly integrated into the simulation program, allowing viewers to immediately see how the line efficiency changes with amendments and adaptations. In the future buffer segments, format changeover times, maintenance intervals, and operator routes will be included in this. Line optimization can include information on media consumption Recording the consumption of media, such as electrical power, compressed air, CO2, and water, can be included in the line optimization procedure. KHS has electronic metering devices for water, steam, and liquid which record flows using ultrasound. A diagram illustrates all the energy fluxes on the line. Following the analysis KHS shows customers how their media consumption can be reduced. For example, an older bottle washer can hugely profit from having its steel carriers and steel bottle pockets replaced by energy-saving bottle carriers equipped with plastic bottle pockets. The mere use of energy-saving carriers in the washer enables 10 to 15% heat and 15 to 20% fresh water to be saved. There is also less caustic carryover. Another way of saving energy is to convert the electric heater in a packaging machine's shrink tunnel to gas. All this entails is to simply swap the electric heating cartridges for gas heating cartridges and connect the shrink tunnel up to a gas line. This results in an energy saving of up to 50% – plus the environment benefits from an up to 60% reduction in CO2 emissions. A clear win/win situation To sum up, those looking for savings potential in beverage operations should start looking where great reserves lie dormant – the line equipment. Expert knowledge on line optimization is priceless in the truest sense of the word. In other words, line optimization is always a win/win situation for all those involved.

